Finviz Review 2026: Free Screener vs Finviz Elite

We are reader-supported. When you buy through links on our site, we may earn a commission (see affiliate policy).
Finviz Review
Finviz is one of the most popular free stock screeners for traders and investors. It combines stock screening, market maps, charts, news, insider trading data, portfolio tracking and market research tools in one simple web-based platform.
The main reason Finviz is so popular is that it is easy to use. You can open the website, apply filters and find stocks within seconds. The interface is not the most modern, but it is fast, practical and familiar to many traders.
Finviz is especially useful for basic stock screening, market overview, sector analysis and quick research. It is not as advanced as Trade Ideas for real-time day trading or TradingView for charting, but for a free stock screener, it remains one of the strongest options available.
Finviz Elite is the paid version. It adds real-time quotes and charts, alerts, export/API access, advanced screener features, backtesting, ETF and fundamental data and an ad-free interface. Finviz Elite currently costs $39.50 per month or $299.50 per year, which works out to $24.96 per month on annual billing. Finviz also offers a 7-day Elite trial. :contentReference[oaicite:0]{index=0}
What Is Finviz?
Finviz, short for Financial Visualizations, is a stock market research platform best known for its free stock screener. It allows users to filter stocks by descriptive, fundamental and technical criteria.
In addition to the screener, Finviz offers market heat maps, charts, financial news, insider trading data, futures, forex, crypto, groups, portfolio tools and market performance snapshots.
Finviz is web-based and does not require complicated setup. Many features can be used for free, although registration is required for some saved features and Finviz Elite is required for real-time data, alerts, exports and other advanced tools.
Who Is Finviz Best For?
Finviz is best for traders and investors who want a fast, simple and affordable stock screener. It is especially useful for users who want to filter stocks by price, market cap, volume, sector, valuation, performance, chart patterns or technical indicators.
The free version is strong enough for casual research and watchlist building. Finviz Elite is better for users who need real-time quotes, alerts, exports, backtesting and an ad-free workflow.
Finviz is less suitable for professional day traders who need ultra-fast intraday alerts, Level 2 data, news squawk or advanced AI trading signals. For that type of workflow, tools like Trade Ideas, Benzinga Pro or Scanz are stronger.
Best For
- Beginner traders
- Casual investors
- Swing traders
- Users looking for a free stock screener
- Investors who want quick market research
- Traders building simple watchlists
- Users who want heat maps and market overview tools
- Traders who need basic technical and fundamental filters
Not Best For
- Professional day traders who need advanced real-time alerts
- Users who need Level 2 data
- Traders who need AI-generated trade ideas
- Investors focused mainly on international markets
- Users who want advanced charting and drawing tools
- Options traders who need deep options flow tools
Finviz Features
Finviz offers several useful tools for market research. The most important features are the stock screener, heat maps, charts, news feed, portfolio tools and insider trading data.
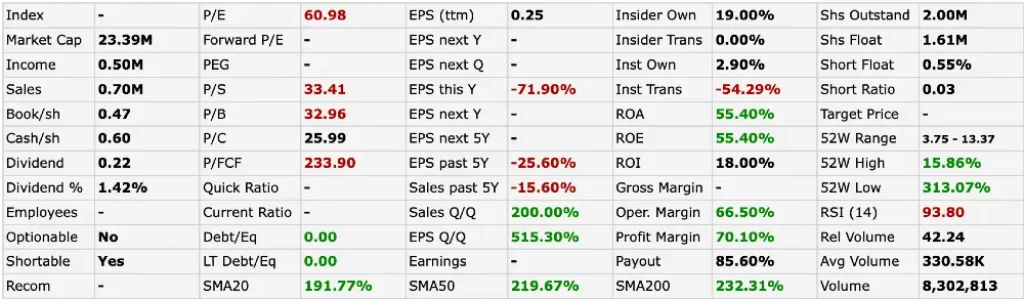
Finviz Stock Screener
The stock screener is the main reason most people use Finviz. It allows users to filter stocks using many different criteria and quickly narrow the market into a smaller list of candidates.
Finviz organizes screener filters into three main categories:
- Descriptive filters: sector, industry, country, market cap, price, volume, exchange and shares outstanding.
- Fundamental filters: P/E, forward P/E, PEG, EPS growth, sales growth, dividend yield, profit margin, debt/equity and other company metrics.
- Technical filters: performance, moving averages, RSI, volatility, patterns, gaps and other price-based conditions.
This makes the Finviz screener useful for several trading and investing styles. Value investors can search for low P/E stocks. Momentum traders can search for stocks making new highs or moving above key moving averages. Swing traders can combine price action, volume and sector filters.
Finviz Elite is not required to use the core screener, which is one of the platform’s biggest advantages. However, Elite is required for features such as real-time data, alerts and data export. :contentReference[oaicite:1]{index=1}
Finviz Heat Maps
The Finviz heat map is one of the platform’s most recognizable features. It gives a visual overview of market performance by sector, industry or individual stock.
Green boxes show stocks that are rising, while red boxes show stocks that are falling. Larger boxes represent larger companies by market capitalization. This makes it easy to see which areas of the market are strong or weak at a glance.
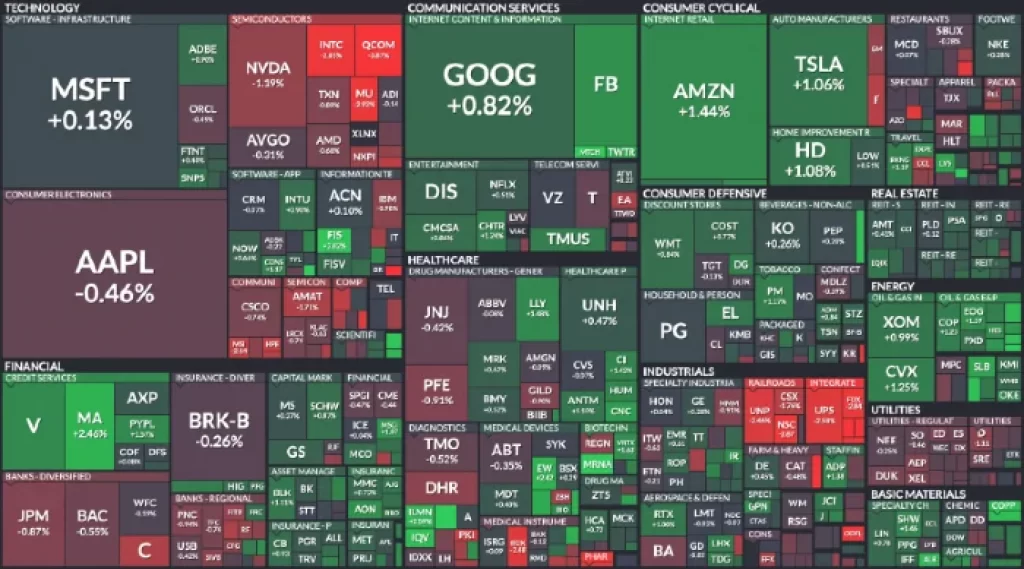
The heat map is useful for quickly understanding market breadth, sector rotation and investor sentiment. For example, if most technology stocks are green while defensive sectors are weak, that may indicate risk-on market behavior.
Finviz also offers a bubble view, which shows stocks by sector and performance in a different visual format. These tools are useful for traders who want a quick market snapshot without reading through long tables.
Finviz Charts
Finviz includes stock charts that make it easy to review price action directly from the screener or ticker pages. The charts are useful for quick technical analysis and can show patterns, trendlines, moving averages and basic indicators.
The charting is good enough for a free stock screener, but it is not as advanced as dedicated charting platforms such as TradingView. Traders who need advanced drawing tools, many indicators, multi-chart layouts or custom scripts will probably prefer TradingView.
For quick review, Finviz charts are very convenient. You can screen for stocks and quickly inspect the chart without leaving the platform.
Finviz News
Finviz includes a financial news section that aggregates headlines from major financial media and market sources. It separates general market news from blogs and commentary, making it easy to scan recent headlines quickly.
You can also view company-specific news by searching for a ticker. This is useful when a stock appears in your screener and you want to quickly check whether there is a recent catalyst behind the move.
The news section is useful for research, but it is not a full real-time news terminal. If fast breaking news is your main priority, Benzinga Pro is a stronger choice.
Finviz Portfolio Tool
Finviz also includes a portfolio tool. Users can add stocks and ETFs to track performance, monitor P&L and follow related news.
This is useful for investors who want a simple way to monitor a watchlist or portfolio inside Finviz. It is not as advanced as dedicated portfolio analytics platforms, but it adds convenience for users who already rely on Finviz for screening and research.
Finviz Insider Trading Data
Finviz tracks insider transactions by company executives, directors and other insiders. This can help investors see whether insiders are buying or selling shares.
Insider buying can sometimes be a positive signal because executives may be showing confidence in the company. Insider selling is more complicated because insiders may sell for many reasons, including diversification, taxes or personal liquidity. Large repeated sales may be worth reviewing, but insider selling alone should not be treated as a clear bearish signal.
Finviz uses color coding to make insider transactions easier to read. This feature is useful for investors who include insider activity as part of their research process.
Finviz Free vs Finviz Elite
Finviz has a strong free version and one paid plan called Finviz Elite. The free version is good enough for basic screening, market maps, charts, news and research. Registered free users can access some saved features.
Finviz Elite unlocks the full feature set, including real-time quotes and charts, an ad-free interface, the advanced screener, ETF and fundamental data, export/API access, push alerts and more. :contentReference[oaicite:2]{index=2}
The biggest reasons to upgrade are real-time data, alerts, exports, backtesting and removing ads. If you only use Finviz occasionally, thefree version may be enough. If you rely on Finviz daily, Elite can be worth considering.
Finviz Elite Pricing
Finviz Elite currently costs $39.50 per month or $299.50 per year. Annual billing works out to $24.96 per month. Finviz also offers a 7-day Elite trial that automatically renews into a paid subscription unless cancelled before the trial ends. :contentReference[oaicite:3]{index=3}
All paid plans unlock the same Elite feature set. The difference is simply monthly billing versus annual billing. Annual billing is cheaper over a full year, but monthly billing may be better if you only want to test the platform for a short period.
Is Finviz Elite Worth It?
Finviz Elite is worth it if you already like the free version and want real-time data, alerts, exports, backtesting and an ad-free experience. It is especially useful for traders who use the Finviz screener every day and want a faster, cleaner workflow.
It may not be worth it if you only use Finviz casually or if you need a more advanced trading platform. Elite improves Finviz, but it does not turn it into Trade Ideas, Benzinga Pro or TradingView.
For active day traders, Finviz Elite can be useful, but it is still not a specialist real-time scanner. For AI alerts, intraday momentum scans and more advanced trade discovery, Trade Ideas is stronger. For charting, TradingView is stronger. For news alerts, Benzinga Pro is stronger.
Finviz Pros and Cons
Pros
- Excellent free stock screener
- Fast and easy to use
- Good mix of descriptive, fundamental and technical filters
- Useful heat maps and bubble charts
- Company-specific news pages
- Insider trading data included
- Elite adds real-time quotes, alerts and exports
- Good value compared with many paid research platforms
- Useful for beginners, swing traders and casual investors
Cons
- Not a specialist day trading scanner
- Free version has ads and delayed data
- Charting is weaker than TradingView
- No AI stock picking or AI trading signals
- Mainly focused on U.S. markets
- Not ideal for options flow or Level 2 data
- Interface feels dated compared with newer platforms
Finviz vs Trade Ideas
Finviz and Trade Ideas are both stock scanning tools, but they are built for different users.
Finviz is better for free screening, quick research, market maps and simple filtering. It is cheaper and easier to use. Trade Ideas is better for serious active traders who need real-time alerts, AI-powered trade ideas, premarket scanning, custom formulas and advanced intraday workflows.
Use Finviz if you want a free or low-cost screener. Use Trade Ideas if you day trade and need a professional real-time scanner.
Finviz vs TradingView
TradingView is stronger for charting, watchlists, alerts, scripts and technical analysis. Finviz is stronger for fast stock screening, market maps and quick research.
Many traders use both. Finviz can help find stocks using the screener, while TradingView can be used for deeper chart analysis.
Finviz Review Summary
Finviz is one of the best free stock screeners available. It offers a strong combination of screening filters, market maps, news, charts, insider data and portfolio tools in a simple web-based platform.
The free version is useful enough for many traders and investors. Finviz Elite is worth considering if you want real-time data, alerts, exports, backtesting and an ad-free interface.
Finviz is not the best choice for advanced day trading alerts, AI trading signals or professional charting. But for fast screening and market research, it remains one of the most useful tools on the market.
For alternatives, see TradingView and Trade Ideas.